k

Growth & Income Stock: Kaman Corp

Kaman Corp (KAMN: 28.11 0.00 0.00%) has been surging lately.

The company recently delivered third quarter earnings per share of $0.49, beating the Zacks Consensus Estimate by 26%, driven by double-digit sales growth and an expanding operating margin. Analysts have also been revising their estimates higher following the strong quarter.

Although the share price has risen over 30% since early September, the stock still appears reasonably valued.

Company Description

Kaman Corp operates in two segments: Industrial Distribution (62% of sales), and Aerospace (38%).

The Industrial Distribution division is the third largest power transmission and motion control industrial distributor in North America.

The Aerospace segment is a manufacturer and subcontractor in the global commercial and military aerospace and defense markets.

The company is based in Bloomfield, Connecticut and has a market cap of $740 million.

Third Quarter Results

On November 1, Kaman Corp reported it results for the third quarter of 2010. Earnings per share came in at $0.49, beating the Zacks Consensus Estimate of $0.39. It was a 32% increase over the same quarter in 2009.

Net sales increased an impressive 24% year-over-year. The Industrial Distribution division saw sales growth of 37%, including organic sales growth of 17%. The Aerospace segment grew by 7%.

Operating income increased 33.6% year-over-year, while the operating margin expanded from 5.1% to 5.4%.

Outlook

Analysts have been revising their earnings estimates higher following the strong third quarter, propelling the stock to a Zacks #2 Rank (Buy).

The Zacks Consensus Estimate for 2010 is $1.31, up from $1.22 before the third quarter earnings release. Although it represents just 3% growth over 2009 EPS, the 2011 estimate is currently $1.97, corresponding to 50% growth over 2010.

Fundamentals

The stock has been on a tear lately, surging almost 33% since September 1.


Despite the run up, shares are still trading with reasonable values. The stock trades at 21.7x forward earnings, a premium to the industry average of 18.4x.

Its price to book ratio is in-line with its peers, however, at 2.1.

Kaman Corp has a dividend yield of 1.9%. The company has not raised it since 2007, however.

Todd Bunton is the Growth & Income Stock Strategist for Zacks.com.

Momentum Stock: Ameriprise Financial, Inc.

Ameriprise Financial, Inc. (AMP: 53.48 0.00 0.00%) just hit a new multi-year high at $55.06 after reporting an awesome Q3 earnings surprise of 28% in late October. Estimates have since jumped higher, with the next-year estimate projecting 17% growth, providing some very nice upward momentum for this Zacks #1 rank stock.

Company Description

Financial, Inc., through its subsidiaries, provides financial planning products and services in the United States. The company was founded in 1894 and has a market cap of $13.5 billion.

With the global economy showing signs of recovery and the stock market charging higher on strong earnings, Ameriprise's business has been on the upswing. That dynamic showed up on Oct 28 when the company reported excellent Q3 results that once again beat expectations.

Third-Quarter Results

Revenue for the period was up 26% from last year to $2.4 billion. Earnings also looked great, coming in at $1.37, 28% ahead of the Zacks Consensus Estimate, where the company now has an average earnings surprise of 31% over the last four quarters.

The strong results were driven by a huge increase in owned, managed and administered assets, up 48% from last year to $649 billion on its acquisition of Columbia Management and general equity appreciation.

Total client assets were also up, increasing 9% from last year to $313 billion on both inflows and capital appreciation.

Share Buy Backs

Ameriprise was also busy returning value to its shareholders during the quarter, buying back 3.6 million shares for $153 million.

Strong Balance Sheet

The company also has a lot of liquidity on its balance sheet, with $3.7 billion in cash and equivalents with a total debt load of more than $9 billion due to its recent acquisition.

Estimates

We saw some pretty solid movement in estimates on the good quarter, with the current year adding 32 cents to $4.38 and the next-year estimate adding 16 cents to $5.15, a bullish 17.50% growth projection.

Valuation

Not only is AMP looking bullish, it also has value, trading with a forward P/E of 12.5X, a nice discount to its peer average of 17X.

2-Year Chart

On the chart, AMP recently hit a new multi-year high at $55.06 after jumping higher on the good quarter. The MACD below the chart is bullish too, with the short-term average trading ahead of the long-term average. Look for support from the trend line on any weakness, take a look below.

Crude Oil Struggles To Break Out Ahead Of Inventory Figures, Gold Finally Buckles As The Dollar Rallies

Commodities – Energy

Crude Oil Struggles to Break Out Ahead of Inventory Figures

Crude Oil (WTI) – $86.30 // $0.42 // 0.48%

Commentary: Crude oil dropped $0.34, or 0.39%, on Monday to settle at $86.72. Prices earlier hit new 25-month highs at $87.63 before backing down. While crude was down, it held up better than U.S. equity markets which fell 0.8% on profit taking. A stronger dollar also weighed on crude. As commodities are denominated in U.S. dollars, strength in the currency is sometimes used as an excuse to sell. But while crude fell, other commodities such as copper continued to soar to new multi-month highs. Incidentally, copper is now nearing its all-time high levels of 2008.

With news flow light this week, traders be watching Wednesday's Department of Energy inventory report closely for guidance. The API survey was extremely bullish, showing a 7.4 million barrel withdrawal in crude stocks, a 3.4 million barrel draw in gasoline stocks, and a 4 million barrel draw in distillate stocks. If the government report shows anything close to these numbers, crude should be well supported.

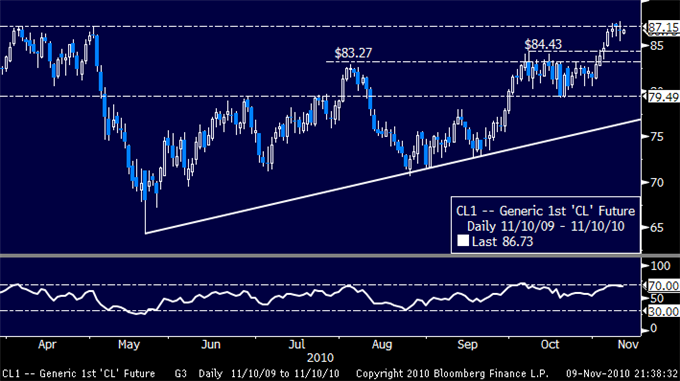
That being said, crude has not yet broken decisively above the $87.15 May highs. Granted, it briefly hit levels above those highs, but until we get a decisive breakout, the bulls cannot claim victory. As of now, the 13-month range between the high-$60's and mid-$80's still stands. And though we expect crude to break higher in the coming weeks and months, there is nothing to prevent a minor correction given the huge gains of the past couple of weeks.

Technical Outlook: Prices have stalled after putting in a bearish Hanging Man candlestick at $87.15, the major swing top set in May that – until last week – served as the 2010 yearly high. Negative RSI divergence continues to point toward (at least) a pullback, with a reversal lower initially targeting resistance-turned-support at $84.43, the 10/07 wick high.

Crude_Oil_Struggles_to_Breakout_Ahead_of_Inventory_Report_Gold_Finally_Buckles__body_11102010_OIL.png, Crude Oil Struggles to Break Out Ahead of Inventory Figures, Gold Finally Buckles as the Dollar Rallies for a Third Day

Commodities – Metals

Gold Finally Buckles as the Dollar Rallies for a Third Day

Gold – $1396.30 // $3.40 // 0.24%

Commentary: A third day of gains in the U.S. Dollar was finally enough to pull gold prices down, but not before they hit yet another record high at $1424.60. Prices ended the day $16.65, or 1.18%, lower at $1392.90. After two days in which it seemed the strong inverse correlation between gold and the dollar was breaking down, perhaps the gold-dollar relationship is reverting back to its usual self. But in the bigger picture, even if the U.S. dollar manages to string together something of an uptrend here, gold bulls likely won't believe that it is anything but an oversold bounce.

With gold prices so overbought— having increased much more than one would suspect given the increase in gold ETF holdings—a selloff would not be surprising, especially if the dollar keeps rising. But any dips in gold will likely be seen as buying opportunities by a large swath of market participants. Many are seeking long-term protection against the debauchment of fiat currencies, and gold is seen as the vehicle that will give this protection.

To get a more sustainable downtrend in gold going, central banks around the world have to at least begin to end the current easy money paradigm that is so prevalent. If we see interest rate hike expectations for the Fed and ECB increase, that may be the trigger for all the investment capital tied up in gold to head for the exits. But most would agree that any rate hikes are still far off.

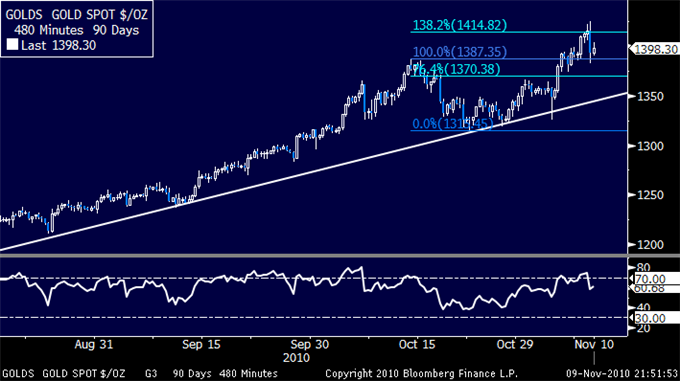
Technical Outlook: Prices have retreated from resistance at $1414.82, the 138.2% Fibonacci extension of the 10/14-10/22 downswing, to meet resistance-turned-support at $1387.35, the mid-October swing high. Near-term resistance remains unchanged while a break past current support exposes the 76.4% Fib at $1370.38.

Silver – $27.24 // $0.32 // 1.17%

Commentary: Silver had an incredible whipsaw session on Tuesday, first rising almost 6% to hit a 30-year high at $29.36, but ending the session down $0.83, or 2.97% to settle at $26.92. The price action in silver is out of control and extremely characteristic of a animal spirits run amok. With volatility so high, only the most aggressive traders should consider a position in silver.

The gold/silver ratio rose slightly to 51.1, but remains near the lowest levels of the year and near the levels of February 2008. (The gold/silver ratio measures the relative performance of the two precious metals. A higher ratio indicates gold outperformance, while a lower ratio indicates silver outperformance).

Technical Outlook: Prices dropped sharply lower having set a new 30-year high at $29.36 to meet support at $26.87, the 38.2% Fibonacci retracement of the 10/21-11/09 advance. Continued selling targets the 50% Fib at $26.10. Near-term resistance lines up at $27.82, the 23.6% retracement level.

Crude_Oil_Struggles_to_Breakout_Ahead_of_Inventory_Report_Gold_Finally_Buckles__body_11102010_GLD.png, Crude Oil Struggles to Break Out Ahead of Inventory Figures, Gold Finally Buckles as the Dollar Rallies for a Third Day


Where The US Dollar And Stock Market Are Headed In The Short Term

With the market performance being so closely linked to the dollar and given the intraday reversals in metals and mining stocks Tuesday, I thought it would be interesting to have a look at the dollar.

The dollar bounced off long term support (see the weekly chart in the end) on Friday and has moved up nicely since then. This move is coming off a positive MACD divergence. MA(50) has acted as resistance in the recent past and another test of it looks to be on the cards. It currently stands at 78.98.

So, watch out for the MA(50) for an idea of where the dollar, and quite possibly the markets, are headed in the short term.

And here is an updated weekly chart of the one that I had posted last Friday. As it can be seen, the dollar has bounced nicely off long term trendline support.

Stock Trading Plan For Wednesday: BAC, GLD, GS, TBT, AKAM, FCEL

We have been warning our members to be careful buying at these nosebleed levels and today those who got greedy and chased after the winning stocks, got beat.  Most sectors ended in the red and the commodity driven areas were especially off big on Tuesday.  As the Dollar bounces here, profit takers should continue to bludgeon the overextended commodity related issues but with so many extended charts we could see continued selling across the board.

In fact on Tuesday Treasuries fell, equities fell, commodities fell and both oil and gold fell as well. Basically everything has gotten so overbought it had to come down at some point. There is some talk of a failed 10 year treasury auction from today but no reason to panic. When the market goes lower people fish for any reason of why instead of understanding what an overbought and oversold chart looks like.  As our member know we got in 2 days before the late August rally started and have been taking profits for some time, selling our stocks to the traders whose market timing is wrong.  Luckily for us that is 90% of all market participants which gives us plenty of liquidity for when we cash in.

Our SPDR Gold Shares (GLD: 135.59 0.00 0.00%) position looks to be reversing off its all time highs but so far is just a normal pullback.

As the US Dollar continues to bounce off recent lows, the market  finally began to get back to reality and started its long overdue pullback. The good news for longs is the major indices are still trading above their 10 period moving averages (pink lines). This is where aggressive buyers show up to buy in extremely strong markets so it will be important to see if we have an orderly pullback into that area or if we slice right through.


Obviously if you find aggressive buyers at these minor support areas you have an extremely strong market on your hands. Due to the fact we have gone so far off the bottom we feel it is more likely that we at least pullback to the 21 day moving average area (blue line).

Our short term profit target on Goldman Sachs (GS: 166.55 0.00 0.00%) was hit, allowing us to lock in a 6.75% gain since our Oct 26  entry point on ½ of our position. We have now moved our stop to break even for the remaining portion and now have a free trade on (barring a gap down).

Locking in profits on FuelCell Energy (FCEL: 1.43 0.00 0.00%) seems like a much better move Tuesday after it fell over 8% intraday.

We are up almost 6% on ProShares UltraShort 20+ Year Treasury (TBT: 36.49 0.00 0.00%) when everyone else on the street was taking the other side of that trade. You heard it here first and are already in the money on this one if you took this unique pick.

We have some concerns over our Akamai Technologies (AKAM: 51.56 0.00 0.00%) trades. They are in normal pullback mode but they lost their Netflix (NFLX: 170.46 0.00 0.00%) deal to Level 3 Communications (LVLT: 1.05 0.00 0.00%).  This could be the start of pricing pressure for AKAM but the charts will tell us how to play this one and so far we are hanging on.

NEW SETUPS

Bank of America (BAC: 12.27 0.00 0.00%) short on a move below $12.13.