k

2011 Stock Market Outlook And Video – Part 2

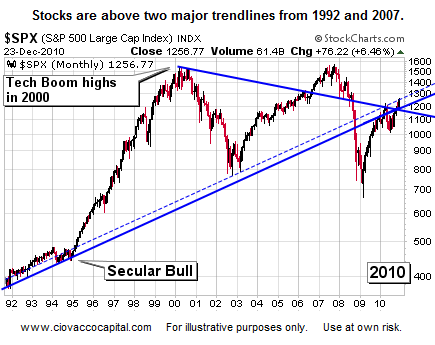
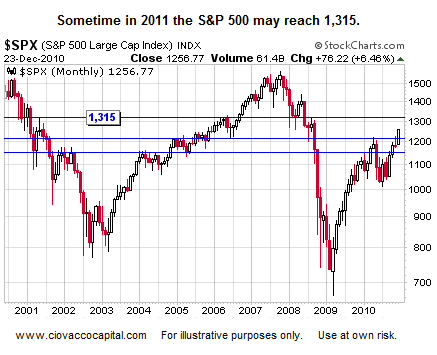
As we kick off 2011, there are plenty of things for investors to worry about, including budget imbalances in developed nations, high levels of bullish sentiment, and a fear of rising interest rates. As of late December 2010, the market's technical profile remains healthy relative to the outlook for the next few months, something we expand on in the video below.

From Wall Street's perspective, the positive drivers for stocks in 2011 include:

  • The recent extension of the Bush Tax Cuts.
  • Little in the way of double-dip talk.
  • Positive outlook for the economy and earnings.
  • Favorable market seasonals and cycles.
  • Many companies have large stores of cash.
  • Consumer confidence is picking up.
  • The Fed's desire to inflate asset prices.
  • Consumer balance sheets have improved a bit.
  • Stock valuations are not excessive (from the perspective of many).
  • Low CPI inflation.

Part II of our 2011 stock market outlook expands on some of the concepts above with an emphasis on (a) what could derail the bull, and (b) the S&P 500's technical profile. The technicals are discussed in a manner that can be understood by both professionals and investors who have limited experience with market charts. Copies of the charts reviewed in the video, as of December 23, 2010, are below the video player. A larger version of the video player can be found here.

Part I of II can be found in Risk Assets Respond to Quantitative Easing.

2011 Investment Outlook - Stock Market Blog

Investing in 2011 - Investment Blog

2011 Stock Market Predictions - Stock Market Blog

2011 Investment Outlook - Stock Market Blog

    Outlook 2011: Five Stocks Due For A Pullback (CAT, AMZN, NFLX, X, BIDU)

    It is inevitable that when you have a market run up like we have had recently driven mostly by liquidity and Santa Claus Rally, many stocks would see pullbacks in the New Year.

    The following are just five of such candidates that I believe capable of some meaningful downside actions, and is not intended to be an all inclusive list.

    Could This CAT Bounce?

    Caterpillar (NYSE:CAT) stock has had an enormous run and has finished the year right at its 52 week high mainly on the emerging markets and global resources/commodities trade. A very well run corporation, but there are a couple of challenges for 2011.

    First of all, everybody and their uncle are already in this stock. Second, the 31 P/E Ratio for a Farm & Construction Machinery company seems a little rich when compared to an Apple for example, with a P/E Ratio of 21, and they are a tech firm which usually carry higher P/E Ratios.

    Third, China, a major market for CAT, is battling an escalating inflation problem, and I expect Beijing to undergo a severe tightening during the first half of 2011, with at least three interest rate raises during 2011. Last but not least, due to global inflation pressures, CAT`s input costs are going to go up, which puts a squeeze on margins.

    Look for a significant pullback to the $84 level where it should find some initial support, with the 80 level being much stronger support. If CAT breaks the $80 level this should be a warning sign for investors to re-evaluate the reasons for this technical breakdown. Is it a general stock market decline, or something company specific like a bad earnings report with poor guidance going forward.

    Just remember that any noteworthy negative news regarding the global growth story could affect CAT more than the general market, and specifically, if you see a selloff in the agricultural space due to tightening measures, caterpillar will experience its share of red in market cap.

    Amazon (NASDAQ:AMZN) – It's a VaR Jungle Out There

    This is another momentum stock from 2010, and talk about high expectations built into this stock as AMZN has a lofty P/E Ratio of 74. Amazon is also finishing the year right at the top of its 52 week high at $182 a share.

    I think the best argument for a pullback in this stock is to look what happened last year. Amazon started 2009 at around $54 a share and finished 2009 at approximately $137 a share, a similar stellar liquidity driven year as 2010. Well, the stock pulled back dramatically at the start of 2010 going from the 52 week high area of $137 starting the year to the $116 a share level by February 8th.

    Basically a five week decline on pure profit taking after portfolio managers ran the stock up at the end of the preceding year trying to maximize their numbers. I would expect a similar decline for the beginning of this year as well, maybe even some early sellers the last week of the year trying to beat the herd to the exits on this stock.

    Expect the pullback to test the $160 area, and if earnings disappoint in late January, expect a sharper correction to the $145 level as short sellers pile in on technical breakdowns pushing stocks lower than they ordinarily would drop on just profit taking alone. That`s the thing you have to remember about Wall Street, stocks usually go a lot lower or higher than you can ever imagine once a directional shift picks up momentum.

    On the fundamental side of the equation, Amazon is basically a retail play, and the holiday season is their strongest part of the earnings each year. Once the holidays are over, the stock lacks a catalyst going forward because unlike last year, the company doesn`t have a similar new product like the Kindle offerings to inspire investors. In fact, with a dozen new tablets hitting the market in 2011 in all shapes and sizes, expect much more competition in terms of content providers and device readers.

    I'd be very careful with Amazon if you're long.  The stock appears to have little if any immediate upside potential, and is almost a certainty to pullback to $170 faster than you can say "I should have sold when it was $185". Furthermore, there is much more downside risk when a stock has run up this much.

    The obvious strategy now is to take profits, wait for the inevitable pullback, and get back into this stock ideally after the summer doldrums where most techs are week. A good time to buy this stock would be around late July as last year there was a prolonged selloff starting in late April to the start of July where it was around $110 a share.

    I would expect a selloff at the beginning of the year. Then buyers would come in and buy the first dip, before the yearly low is put in again during the second selloff of the year around July. There is a reason the old axiom of "Sell in May, and go away" exists in the investing lexicon. The summer often is exemplified by lower VaR (Value at Risk) by the institutional investors, and is historically replete with some of the weaker investment months of the year.

    The goal should be to buy the second selloff of the year, and ride the stock straight through the annual Christmas run up through late December.

    Netflix (NASDAQ:NFLX) – Another AOL?

    This is a stock that befuddled many shorts in 2010, until it finally had a nice pullback after soaring to $209 a share around December of 2010.  However, as stated in my previous analysis, there is more downside ahead for this stock as it is still quite pricy with a P/E Ratio of 70. It was also in a sweet spot in terms of competitors with the bankruptcies of the brick and mortars in the space.

    The company was successful enough for others to take notice, but you may expect new product offerings from existing players, and entirely new players altogether in the space for 2011. In short, Netflix`s sweet spot in the space is over.

    Technically speaking, expect the pullback to test the $150 level during the first quarter of 2011, and if there is a major earnings disappointment, the $120 level of support is next in line for this stock. If it breaks the $120 area, then chances are this represents a broken stock, and it is best advised to avoid catching the falling knife even on a valuation play. Remember, this stock was a momentum stock, a fad stock, and heavily shorted in 2010.

    So far, there seems nothing in Netflix`s business model that cannot in some way be outdone, duplicated, or even refined in a more appealing, efficient product offering by a large competitor with much bigger pockets. So, there will be a new momentum stock in 2011, the shorts will no longer be adding fuel to the fire via successive short squeezes, and all fads come to an end as consumers look towards the next cool thing.

    NFLX is another stock with very limited upside and an abundance of downside risk at this point for savvy investors. The question with this stock a la CROX, is not whether this stock pulls back, but more so of how low will it fall, remember CROX`S fall from the $75 area at the peak of its hype all the way to a dollar a share in a year`s time.

    The tech sector currently is looking more and more like the tech bubble back in 2000. So, the other intriguing question is whether Netflix would even be around in five years time with the evolutionary changes bound to occur in this space?

    It could be Netflix presence in the space might resemble an AOL type of scenario in which after changes in technology made AOL`s business model obsolete– Could Netflix end up being another AOL?–just hanging around in a reduced state for a decade after their glory days? And AOL was a lot bigger than Netflix back then.  It is certainly something to pounder upon.

    Bottom line is that investors who are currently in the stock should pick a point where they will get stopped out of this stock if the momentum run is indeed over in 2011.

    United States Steel (NYSE:X) – Better Be A Price Taker at Lower Levels

    This is another stock that is ripe for a pullback, and investors should book some profits before the New Year when others are sure to follow suit.

    US Steel was $40 a share in late October, and it piggy backed with the rest of equities the last 8 weeks of 2010 where it sits at the $58 share level, all this with a negative earnings per share to its credit. Expect the stock to test the $45 a share level during the first quarter of 2011, probably sooner than later as the last 8 weeks run up just doesn`t have staying power given the fundamentals in the global economy and the steel market.

    Last year the stock performed this same type of run up into year-end only to pullback significantly in the New Year–in late October of 2009 X went from $35 a share to close out the year near $56 a share in December, it even continued the run for a couple of weeks in January to around the $65 level, only to fall back precipitously to $44 a share by February 8th of 2010.

    Expect the same type of pullback in US Steel for 2011 as this is just a trade for money managers, taking advantage of year end momentum to push up stocks and hit their year-end targets. There should be strong support at the $40 a share level for those interested in getting back into this stock on a pullback. However, if it breaks $37 a share, there is something wrong with this company, and that is your max pain threshold.

    A good rule of thumb regarding established companies like US Steel from a technical standpoint is to look back at the two year chart of the company (although I only show one-year charts here) , and there are two spikes above the current level, and the stock didn`t stay at those levels very long. In fact, the stock spent much more time trading well below the current levels than above it.

    From a logical risk and reward standpoint, do you want to be a buyer or a seller at these levels? For the investor it makes sense to put as much of the odds in your favor, since most investors are price takers, and not price makers, the obvious choice is to be a price taker at a much lower valuation level.

    Baidu, Inc. (NASDAQ:BIDU) – China Tightening Hurts

    BIDU is a high flying tech stock has had quite a run with the highest P/E Ratio in the group at an astounding 83. Part of the rationale to expect a pullback in this stock is that China is going to have a tough time of things for the first half of 2011 while they are in super tightening mode.

    Beijing hiked interest rates 25 basis points on the 25th of December, and I expect 3 more rate increases during the first half of the year as they try to tackle an ever present inflation problem in their economy. As the Chinese market pulls back, so will the US market, but especially stocks that are closely tied to the Chinese market such as Bidu.

    As we speak, the stock is around $100 a share, and expect a significant pullback to the $80 a share level during the first quarter of 2011. The next major area of support is around the $70 a share level. If it breaks $70 a share, some serious questions need to be answered before getting back in on this stock like "Is China`s bubble bursting?" or "Is there a new direct competitor in China?" etc. as this is a technical breakdown of the stock.

    From a technical standpoint Bidu has already started to show signs of putting in a near-term top, as the rest of the market was exploding higher, up 6.5% so far in December, BIDU was actually on the downswing from the $110 high established December 6th. The reason is that China was pulling back on tightening concerns. Well, every week there is some kind of new tightening measure coming out of China, and this is what is pulling Bidu down, in my opinion.

    So now that China has started pulling out the big guns in terms of tightening with interest rate hikes, expect Bidu and the Chinese market to pull back even further. Throw in a long overdue US equities pullback into the equation, and you get the picture–it is not unreasonable for Bidu to test the $80 a share level in the next six weeks.

    But when you have a down trending stock like BIDU in an otherwise robust market, it seems to be sending signals that there is more weakness to come. The idea is that if it is weak now, it should be even weaker when the entire market starts to pull back in early 2011.

    Goal – Not Be The Last Standing

    The one thing we have learned during the last decade is that the buy and hold strategy for the most part is dead, it has been a trader`s market, and the smart money isn`t going to wait for an engraved invitation to sell at these levels. Avoid being the last person standing looking for the musical chair.

    Meanwhile, I would be interested in some of the other candidates that readers think fit the bill as well for potential pullback targets.
    Ford To Expand Fuel-Saving Start-Stop Technology From Hybrids To Conventional Cars, Crossovers

    DEARBORN, Mich., Dec. 27, 2010 /PRNewswire/ —

    • Ford's Auto Start-Stop system will be available for North American cars and utilities in 2012


    • Ford's Auto Start-Stop system boosts city fuel economy between 4 and 10 percent


    • Since 2004, Ford has sold more than 170,000 hybrid vehicles in North America with start-stop and is the leading domestic producer of the systems


    • Ford has at least 244 worldwide patents on its Auto Start-Stop technology, proven on hybrids and soon to be added on cars, crossovers and SUVs in North America


    Ford's popular fuel-saving technology that automatically shuts off the engine when the vehicle comes to a stop – a feature found today on the Ford Fusion Hybrid and Ford Escape Hybrid and some Ford cars in Europe – will soon be added to conventional cars, crossovers and SUVs in North America.

    Ford's patented new Auto Start Stop system for gasoline engines will improve fuel economy for most drivers by at least four percent. The gain can be as high as 10 percent for some drivers, depending on vehicle size and usage. It can also reduce tailpipe emissions to zero while the vehicle is stationary or waiting at a stop light. Ford has more than 244 patents for its Auto Start-Stop technology and will showcase the feature on a concept in January at the North American International Auto Show.

    Auto Start-Stop is the latest example of Ford moving aggressively to bring affordable advanced fuel-saving technologies to all customers. Ford has already introduced electric power steering, dual-clutch PowerShift six-speed transmissions and other fuel-saving features as part of the company's commitment to lead or be among the leaders in fuel economy in every segment.

    Ford's global Auto Start-Stop technology is smooth, quiet and seamless, and it requires no changes to the driver's behavior. In city driving when the vehicle is stopped, the engine restarts the instant the driver's foot leaves the brake pedal. When the engine is off, all of the vehicle's accessories function normally.

    "For the driver, Ford Auto Start-Stop provides extra fuel efficiency without inconvenience, as it works completely automatically," said Barb Samardzich, Ford vice president of Powertrain engineering. "And, just like in our hybrid vehicles, the heater, and air conditioner work as normal so drivers will not sacrifice comfort."

    The global rollout of Auto Start-Stop is under way in Europe. The system, designed to work on both gasoline and diesel engines, is standard on the ECOnetic models of the Ford Ka and Mondeo, and is launching now on Focus, C-MAX and Grand C-MAX. The fuel-saving system debuts in North America in 2012 and eventually will be offered in all of Ford's global markets.

    Many North American Ford customers are already familiar with Auto Start-Stop. A similar system has been installed on more than 170,000 gasoline-electric hybrid vehicles Ford has sold since 2004. Ford is the leading domestic producer of start-stop systems. In 2011, the version of Ford's Auto Start-Stop designed for gasoline-electric powertrains will be on the Escape Hybrid and Fusion Hybrid as well as the Lincoln MKZ Hybrid.

    "Many of the same Ford engineers who designed the Auto Start Stop system used on Ford and Lincoln hybrids are developing the Auto Start-Stop system for non-hybrid vehicles that will be sold around the globe," said Samardzich.

    When Auto Start-Stop debuts in North America, it will be available on gasoline-powered cars and utilities with either a manual or automatic transmission as well as vehicles that use Ford's patented dual-clutch six-speed automatic transmission.

    Ford's aggressive move to direct-injection EcoBoost™ engines is one of the technologies that enable the Auto Start-Stop system to work seamlessly, Samardzich said. The direct-injection system, which sprays the exact amount of fuel directly into the precise location in the combustion chamber, helps enable extremely fast engine starts, Samardzich explained. The system debuts on four-cylinder engines and will gradually be expanded to vehicles with V6 and V8 engines.

    Auto Start-Stop does not require any additional vehicle maintenance. The system uses an enhanced 12-volt automobile battery and upgraded starter motor, said Birgit Sorgenfrei, program manager for Auto Start-Stop.

    "Our hybrid owners tell us that start-stop is one of their favorite features," said Sorgenfrei. "When the engine is off, they know they are saving fuel and reducing emissions."

    The system includes a light on the dash that alerts the driver when the engine is off and a special tachometer that moves the needle to a green zone when the engine is not running.

    Ford engineers are making customer comfort a priority in engineering the system. A special electric pump keeps engine coolant circulating through the heater so drivers will stay warm in cold weather, Sorgenfrei said.

    "Ford's start-stop technology conserves fuel and eliminates emissions at every vehicle idle opportunity once customer comfort and convenience are assured – this is good for the environment," Sorgenfrei said.

    Auto Start-Stop is just the latest in a long list of fuel-saving technologies Ford has brought to market in recent years.

    Ford's industry-leading suite of fuel-saving technologies include:

    • EcoBoost engines, which combine turbocharging, direct injection and twin independent variable camshaft timing or Ti-VCT, with downsizing to deliver outstanding fuel economy without sacrificing performance
    • Improved and highly fuel-efficient TDCi turbo-diesel engines in European models with low emissions and high levels of refinement
    • Electric power steering, which eliminates the engine-driven hydraulic pump, lines and fluid
    • Six-speed transmissions, which enable engines to run more efficiently by always selecting the best gear for fuel economy
    • PowerShift dual-clutch automatic transmission, which efficiently sends the engine's power through the transmission without relying on a torque converter or hydraulic pumps


    In 2011, Ford will be the only manufacturer in North America to offer four vehicles that get 40 mpg or more. Those vehicles, the Ford Fiesta, Ford Focus, Ford Fusion Hybrid and Lincoln MKZ Hybrid, are part of a dozen vehicles leading their sales segments in fuel economy, a record no other manufacturer can match.

    "Ford Auto Start-Stop works so fast and so seamlessly, most drivers won't even notice it is there, though they will notice the benefits in their lower fuel bills," Samardzich said.

    About Ford Motor Company

    Ford Motor Company (F: 16.78 -0.21 -1.24%), a global automotive industry leader based in Dearborn, Mich., manufactures or distributes automobiles across six continents. With about 176,000 employees and about 80 plants worldwide, the company's automotive brands include Ford, Lincoln, Mercury and, until its sale, Volvo. The company provides financial services through Ford Motor Credit Company. For more information regarding Ford's products, please visit www.ford.com

    SOURCE Ford Motor Company

    Momentum Stock: The Cooper Companies, Inc.

    The Cooper Companies Inc. (COO: 56.66 -0.27 -0.47%) just hit a new multi-year high at $59.11 after reporting an impressive Q4 earnings surprise of 20% in early December. With estimates up on the news and the valuation picture in check, this Zacks #1 rank stock has its sights set on momentum.

    Company Description

    The Cooper Companies, Inc., through its subsidiaries, develops and manufactures vision and women's health products. The company's products include contact lenses and medical devices like diagnostic and surgical equipment used primarily by gynecologists and obstetricians. Cooper Companies was founded in 1980 and has a market cap of $2.6 billion.

    Cooper Companies gave its investors reason to cheer on December 7 with strong Q4 results that came in ahead of expectations and put a rubber stamp on a great year for the healthcare-products company.

    Fourth-Quarter Results

    Revenue for the quarter was up 11% from last year to $313 million. Earnings looked even better at $1.04, 21% ahead of the Zacks Consensus Estimate.

    Most of Cooper's revenue comes from it vision segment, where total sales were up 10% from last year to $263 million. From that group, it's Toric products, also known as soft contact lenses, saw the biggest gains, up 14% to $78 million. Its highest revenue product from this segment, non single-use sphere, was up a solid 10% to $110 million.

    In terms of regions, Visions biggest gain came from its biggest region, Americas, up 47% to $124 million. It's Asia business, representing less than 20% of total revenue, was up a respectable 6% to $48 million.

    Cooper's smaller division, women's medical products, was up 14% to $50 million.

    Not only were sales strong, costs and expenses were down, with gross margin showing a big gain to 60% from 56% last year. Operating margin was 20%, looking strong in both categories.

    Balance Sheet

    Buying a bunch of small companies and combining them underneath one umbrella can be expensive, and it shows up in Cooper's balance sheet, with total debt of $611 million, down $35 million from last year, and nominal cash and equivalents of $3.5 million.

    Estimates

    We saw some decent movement in estimates off the good quarter, with the current year gaining 26 cents to $3.46 while the next-year estimate added 28 cents to $3.84.

    Valuation

    With a forward P/E of 16.5X, COO trades at a slight premium to the industry average of 13.5X.

    6-Month Chart

    On the chart, COO jumped higher on the strong quarter, hitting a new multi-year high at $59.11. But in spite of the gains, the stochastic below the chart is signaling that shares are trading far away from over-bought conditions. Look for support from the longer-term trend on any weakness, take a look below.

    Last Week's Momentum Zacks Rank Buy Stocks

    MWI Veterinary Supply, Inc. (MWIV: 64.54 +0.26 +0.40%) recently hit a new all-time high at $64.73 after rallying into the end of the year on a Q4 earnings surprise of 16% from early November. With an average earnings surprise of 23% over the last four quarters and bullish growth projection of 14%, this Zacks #1 rank stock could be your latest pet investment. Read Full Article.

    Dollar Tree, Inc. (DLTR: 56.77 +0.48 +0.85%) continues to trade near its multi-year high at $57.06 on the heels of a solid Q3 earnings surprise of 18%. With consumers still flocking to discount retailers in the shaky economic recovery, this Zacks #1 rank stock has momentum to spare. Read Full Article.

    RBC Bearings, Inc. (ROLL: 38.665 +0.315 +0.82%) recently hit a new multi-year high after reporting strong Q2 results in early November that included its third consecutive earnings surprise. Estimates have since jumped higher, with the next-year estimate projecting 23% growth, helping to eliminate upward resistance for this Zacks #1 rank stock. Read Full Article.

    Michael Vodicka is the Momentum Stock Strategist for Zacks.com. He is also the Editor in charge of the market-beating Zacks Momentum Trader Service.
     
    COOPER COS (COO): Free Stock Analysis Report

    Crude Oil Drops Slightly On China Rate Hike, Gold Digests A 10th Year Of Gains

    Commodities – Energy

    Crude Oil Drops Slightly on China Rate Hike

    Crude Oil (WTI) – $9.38 // $0.13 // 0.14%

    Commentary: Crude oil is kicking off the new week to the downside after the People's Bank of China raised rates by 25 basis points over the weekend. Prices are well off the lows, however, as traders use the opportunity to buy. Readers may recall that last week crude oil broke out to a 27-month high after rising for five sessions in a row. Can the streak be kept alive this week? While there is no doubt the fundamentals are extremely supportive of the commodity at the moment—inventories are drawing down rapidly and global economic growth is continuing robustly—a correction at some point is to be expected given how fast oil has climbed. All that is necessary is a catalyst to spur traders to lock in profits. Though a single 25 basis point hike from the PBoC does not materially change the outlook for China and by extension oil, it may be enough to send prices lower temporarily. Overall, expect volume to be extremely light as we approach the end of 2010.

    Technical Outlook: Prices have paused after taking out resistance at $91.17, the December swing high. Still, positioning suggests the door is open for an advance to test the upper boundary of a rising channel set from August (now at $92.26). The $91.17 level has been recast as near-term support.

    Crude_Oil_Drops_Slightly_on_China_Rate_Hike_Gold_Digests_a_10th_Year_of_Gains_body_12272010_OIL.png, Crude Oil Drops Slightly on China Rate Hike, Gold Digests a 10th Year of Gains

    Commodities – Metals

    Gold Digests a 10th Year of Gains

    Gold – $1383.90 // $2.43 // 0.18%

    Commentary: Last week gold was little changed as capital flowed into other economically-sensitive risk assets. Prices are again doing little as traders await the next catalyst. Overall, 2010 was another solid year for gold, as the metal rose 26% (year-to-date), after rising 26% in 2009 and 5% in 2008. Prices have not put in a negative annual return since the year 2000. Obviously, this streak will end at some point. But the circumstances that have fueled this performance—ever-increasing investment inflows, central banks becoming net buyers, and now surging demand from China—have not gone away. Eventually, prices will reach a point where circumstances change, where supply and demand reach a more sustainable equilibrium—but there is no evidence of that happening yet.

    Technical Outlook: Prices remain locked between $1392.46 and $1380.47, the 32.8% and 50% Fibonacci retracements of the 11/16-12/7 rally, respectively. A break lower exposes the 61.8% Fib at $1368.49, while a push through near-term resistance clears the way for a retest of a rising trend line set from mid-November, now at $1405.37.

    Silver – $29.21 // $0.08 // 0.29%

    Commentary: Silver continues to be well-behaved as the metal consolidates in step with gold.

    The gold/silver ratio rose slightly to 47.4, near the lowest levels since February 2007. (The gold/silver ratio measures the relative performance of the two precious metals. A higher ratio indicates gold outperformance, while a lower ratio indicates silver outperformance).

    Technical Outlook: Prices continue to consolidate between the 14.6%and 23.6% Fibonacci retracements of the 10/22-12/07 rallyat $29.55 and $28.85, respectively. A break above near term resistance exposes the latest swing high at $30.70. Alternatively, a push lower targets the 38.2% Fib at $27.70.

    Bear Of The Day: Vulcan Materials Co. (VMC)

    Despite being the largest producer of construction aggregates and a leading producer of other construction materials, Vulcan Materials (VMC: 44.82 -0.40 -0.88%) faces intense competition and a challenging environment.

    The nearly stalled construction business has yet to show positive signs of recovery, jeopardizing the prospects of the building materials and other related products markets. In the most recent quarter, Vulcan failed to live up to the Zacks Consensus Estimate of $0.19 per share by posting a profit of only $0.08.

    In addition, its cash position has also deteriorated. Based on the above conditions, we continue with our Underperform recommendation on the stock and set a target price of $36.00.

    Yesterday’s 250-Point Rally Very Significant For U.S. Stocks

    I'm looking at the major business newspapers this morning and I see one big story missing from page one of these newspapers, "Dow Jones up 250 points yesterday, single-day gain of 2.3%!"

    Yesterday's big rise in the Dow Jones Industrial Average is very significant for the stock market.

    As a leading indicator, the market predicted the turnaround in corporate profits months ago. That's why stocks are up about 70% from the spring of 2009.

    While not moving in a straight line, the Dow Jones was able to reach a two-year high of 11,451 in early November. In all markets that rise for an extended period of time, profit taking is as natural as the snow the northern states will get this winter. Profit taking took the Dow Jones below 11,000 early this week and then, presto, just like a rubber band, the market rebounds with a huge 250-point rally.

    Why do I see yesterday's one-day rally as significant? Because it signals that the bear market rally that started in March of 2009 still has upside potential. Investors, sitting with billions of dollars on the sidelines, only really have two things to worry about: The real estate market and higher interest rates in the U.S. Otherwise, it's a green light for corporate profits.

    Look at it this way: An investor who bought the Dow Jones on Tuesday made more money on Wednesday than he or she would have by holding U.S. T-bills all year!

    Just this morning…

    Target Corp. (TGT: 58.60 0.00 0.00%), the major American retailer, said its same-store sales rose 5.5% in November from November 2009, beating analyst expectations.

    Saks Inc. (SKS: 11.38 0.00 0.00%), the high-end retailer, said cash registers at its same-store locations rang up 5.3% more in sales this November than in November of last year.

    Gap Inc. (GPS: 21.16 0.00 0.00%), a major American clothing retailer, said this morning its November same-store sales were up four percent from last year, also beating analyst expectations.

    (I told my readers months ago to look at the retail stocks because they would surprise this holiday season on the upside…and they have. I still think the major retail stocks have more room on the upside for price appreciation.)

    Corporations are pumping profits and investors have few choices when it comes to parking their cash. Stocks still look attractive at these prices levels.

    Back to the major headline missing in today's newspapers…

    Very few people writing about the financial news are seasoned financial analysts. What makes a great financial analyst: someone who has traded the markets for at least 20 years; someone who has a major economics or similar educational degree; a person who has studied technical analysis and has taken difficult courses on stock market analysis; and, most importantly, someone who has put their own money on the line and won.

    But think about it for a minute. If a reporter possessed everything I just listed above, why would they be a reporter? Exactly; they wouldn't.

    Michael's Personal Notes:

    I flew back yesterday afternoon from Las Vegas and can tell you this about Sin City:

    Tourists are starting to visit Vegas again. Sure, the hotels are cheaper than ever, and the casinos are not as full as they used to be, but business is 100% better than the dark days of late 2008 when Vegas went "dark" for months.

    The problem in Las Vegas, like every other state that was fast-growing during the boom days that ended in late 2007, is the real estate market. House prices in Vegas are down 40% to 50% from their peak and show no signs of recovery. Developers built condo buildings hoping gamblers would buy them as second homes, and this idea, for the most part, flopped as well.

    The Cosmopolitan of Las Vegas (a huge 2,000-room hotel/casino development) is scheduled to open before Christmas. Deutsche Bank took over the hotel after it foreclosed on its mortgage. I find it very interesting that the bank has decided to keep the hotel complex as opposed to selling it. The bank is likely willing to wait until the market improves before selling the hotel, a big vote of confidence for Vegas.

    Vegas looks a lot like the rest of the U.S. right now: Consumers are slowly opening their wallets, real estate is very depressed, and high rollers, while nowhere near the many that existed in 2006 and 2007, seem to keep the baccarat tables open.

    (On a side note, in November, we broke a record for the number of people who signed up to get PROFIT CONFIDENTIAL—17,776 new readers in one month! Welcome to our thousands of new readers. Each day on these pages, as financial writers, we try our best to analyze today's economic news with a different spin. Like a baseball game, we try to go to where the ball is going, not where it has been. It is very satisfying for our editors to see so many new readers. Thank you!)

    Where the Market Stands; Where it's Headed:

    The Dow Jones Industrial Average starts this morning up 7.9% for 2010. The bear market rally in stocks that started in March of 2009 is alive and well.

    What He Said:

    "Even the most novice investor can now read the chart of the Dow Jones U.S. Home Construction Index and see that it is trading at its lowest level in five years. If, like me, you believe that stocks are an indication of what lies ahead, this important index is telling us housing prices are headed to 2002 levels! What would that do to the economy? Such an event would devastate the U.S." Michael Lombardi in PROFIT CONFIDENTIAL, December 4, 2007. That devastation started happening the first quarter of 2008.

    You Won’t Like What Utility Stocks Say About Interest Rates

    What's with utility stocks and why should investors care?

    Watching the price action of the utility stocks is very important to investors, as the utility stocks are leading indicators of interest rates. By watching the price action of these stocks, we can relate their price direction to where we expect interest rates to go.

    Interest rates are of fundamental importance to all kinds of investors, from active stock market investors to retirees looking for income, to businesses that need to borrow money for their businesses, to even currency traders. The direction of interest rates is of utmost importance to investment decision-making.

    After peaking in December of 2007 at 210, the Dow Jones Utilities Index sits at only 150 today—still down 29% from its high. While other stock sectors, like retail, are close to breaking above their 2007 price highs, the utility stocks are struggling. Why, and what does this mean for interest rates?

    Before we get to the "why" we need to look at where the utility stocks have been. As a big believer in stocks being a leading indicator, the run-up in the price of utility stocks in December of 2007 foresaw the record-low interest rates we would experience in 2008 and 2009.

    While the official Federal Funds Rate remains between 0.25% and zero, the utility stocks are not rising because, in my opinion, they now foresee interest rates rising in the near future. As you know, if interest rates rise, the price of utility stocks declines, as their yields become less attractive when interest rates rise. Stocks in general decline as interest rates rise.

    If we look at all the pieces of the puzzle—record-high national debt that the U.S. government needs to continue financing via the issuance of bonds; pressure on the U.S. dollar to decline in the face of rising national debt; pressure on domestic inflation to rise as the Fed's too-easy money policy goes on for too long—they all point to higher interest rates ahead. The price action of the utility stocks this year confirms my concern over higher interest rates in 2011.

    Michael's Personal Notes:

    A two-page spread appeared this weekend in Toronto's Globe and Mail with the heading, "The Case Against Gold." The article points out that demand for jewelry is on the decline and the supply of gold is rising, and compares the "bubble" in gold bullion to the previous bubbles in high-tech stocks and real estate.

    Everyone's entitled to their opinion. But I disagree with what the writer of, "The Case Against Gold," had to say for several important reasons:

    If we take inflation into account, the price of gold has yet to break to a new price high. Demand for jewelry is obviously falling, as consumers cannot keep up with the rising price of the gold used in jewelry. Bubbles, just like the high-tech bubble of 1997 to 1999 or the U.S. real estate bubble of 2003-2006, can go much higher than common sense could ever expect.

    Finally, gold has always been a safety net and an inflation hedge. Investors and consumers do not know the long-term effects that rising record U.S. debt will have on the greenback. Similarly, we do not know the long-term effects that the unprecedented easy money policies of the Fed will have on inflation. These are the fears that will drive gold.

    Where the Market Stands; Where it is Headed:

    The Dow Jones Industrial Average opens this morning 41 points below its 52-week trading high. I believe the chances favor a breakout by the market to a new high, as opposed to downside action. Both the S&P 500 and the NASDAQ broke to new 52-week highs last week…I don't see the Dow Jones far behind in terms of a new high. If I look back at recent trends, the Dow Jones has lagged behind both the S&P 500 and the NASDAQ in terms of market direction.

    Total return (growth and dividends) this year for the stock market will be in excess of 10%—a better performance than bonds by far, but one only half the return investors would have gotten by being invested in gold bullion.

    The bear market rally in stocks that started in March of 2009 continues.

    What He Said:

    "Consumer confidence does not change overnight. In the U.S., 70% of GDP is based on consumer spending. And, in my life, all the recessions I have seen or studied have only come to an end when consumers started spending. With consumer sentiment getting worse, and with the U.S. personal savings rate near record lows, it may take two or three years for consumers to start spending again." Michael Lombardi in PROFIT CONFIDENTIAL, February 25, 2008. By the end of 2008, the rest of the world was realizing that the recession would be much longer and deeper than most had guessed.

    The Last 10 Years: Why These Stocks Have Always Done Best

    When investing in the stock market, for years I've favored small-caps, penny stocks and even micro-cap stocks over big-cap stocks. Why?

    "The proof is in the pudding," as they say. Big company stocks tend to move up and down with the general stock market. Small company stocks can see their stock prices immediately affected by changes in management, marketing practices, and new product development and discoveries. Big companies, with so many divisions, cannot benefit as quickly from the changes listed above.

    It's been 10 long years for investors and, I'm sorry to report, investors in big company stocks have not fared well at all. Below, please find the closing level of the Dow Jones Industrial Average on December 31 for every year going back to 2000:

    December 31   Dow Jones Industrial Average

    2000                                                        10,786

    2001                                                        10,021

    2002                                                        8,341

    2003                                                        10,453

    2004                                                        10,783

    2005                                                        10,717

    2006                                                        12,463

    2007                                                        13,264

    2008                                                        8,776

    2009                                                        10,428

    2010                                                        11,491 (Dec. 20/10)

    The reality is that, if an investor had bought a basket of the Dow Jones Industrial stocks in 2000, he or she would only be up 6.5% in 10 years! The dividends these big company stocks paid each year hardly kept up with inflation.

    Comparatively, the Russell 2000 Index of small-cap stocks is up about 100% over the past 10 years.

    I monitor the action of the big market index every day here in PROFIT CONFIDENTIAL to establish the market direction, which is of utmost importance to all stock sectors.

    But when it comes to investing in individual stocks, the real money in investing is in small-caps, penny stocks, and micro-cap stocks. Unlike the big-cap stocks, there are over a hundred examples of small company stocks I can give my readers that are trading today at 10 times what they traded in 2000. And that's why I would never invest in big-cap stocks; they simply don't have the profit potential of small company stocks.

    Ask yourself, will companies like Microsoft (MSFT: 27.81 0.00 0.00%), Wal-Mart (WMT: 53.77 0.00 0.00%), GE (GE: 17.70 0.00 0.00%), IBM (IBM: 144.51 0.00 0.00%) or American Express (AXP: 42.50 0.00 0.00%) double in size in the next five years? No. But there are hundreds upon hundreds of small companies that will.

    (Just as an FYI, there is not one major gold producer I could even classify as a big-cap stock. Newmont Mines (NEM: 60.19 0.00 0.00%), the grand-daddy of big gold mining companies, has total market value of $29.0 billion. The majority of the 30 stocks that compromise the Dow Jones Industrial Average have market caps in excess of $100 billion.)

    Michael's Personal Notes:

    I'm surprised to see news reports this morning that France may face a downgrade of its bonds. If you remember, Greece was the first country to face a credit crisis, followed by Ireland, and then credit agency downgrades of bonds issued by the governments of Portugal and Spain.

    If I were a betting man, I would have thought Italy would have been the next country to face a credit agency downgrade of its bonds. And I continue to believe it will be the next major European Economic Community (ECC) to face financial problems, especially in light of the country's delicate political environment.

    France was the first real European country to take serious austerity measures, such as raising the official retirement age to 62 from 60. France is simply a casualty of a downgrading of debt sweeping the entire ECC.

    How can an investor make money from all the debt downgrades and credit crises hitting European countries? Shorting the euro is too risky. The easy money has already been made on the euro. Shorting specific European country bonds has been a big play this year and there is still likely money to be made with that play.

    But for average-risk investors who prefer to invest in their own backyards, the best play in 2011 will be to take a vacation in your favorite European country. Top-rated European hotels are offering the best deals I've seen in years. The tourism industry is hungry right now in Europe. We will see some great deals on travel to Europe this summer.

    Where the Market Stands; Where it's Headed:

    The Dow Jones Industrial Average opens today (what will be a quiet trading week) up 10.2% for 2010. The bear market rally that started in March of 2009 tapered off in 2010, but still provided investors with a decent return for the year.

    I'm of the opinion that this bear market rally still has leg left. I'm concerned going into 2011 about long-term interest rates rising, but in the immediate term I'm still bullish on stocks.

    What He Said:

    "Investors have been put into an unfair corner. Those that invested in stocks because they got caught in the tech boom (1999) have seen their investments gone. Now, those that have leveraged heavily to play the real estate game, because it is the place to be (2005), could see the same fate as the stock market investors. Thanks again, Mr. Greenspan." Michael Lombardi in PROFIT CONFIDENTIAL, May 27, 2005. Michael started warning about the crisis coming in the U.S. real estate market right at the peak of the boom, now widely believed to be 2005.

    Looming Sugar Shortage Launches Sugar ETFs

    On Friday, concerns over future supplies of sugar pushed prices up to their highest levels since November 10th as inclement weather in the US and declining output in Brazil pave the path to projected shortages on the supply side of the commodity. 

    Mother Nature is delivering one of the coldest weathers in the past decade throughout parts of the United States causing freezing temperatures in Florida to severely damage sugarcane crops and limit future production of sugar. 

    Further supply concerns have been fueled by recent data coming out of Brazil, the largest per capita sugar producing nation in the world.  According to Unica, a sugar industry group, sugar output in Brazil's largest producing region declined by 18 percent in the second half of November from a year earlier and production is expected to continue to decline in the coming months. 

    Thirdly, a supply shock has started to form due to a judicial ruling which threw out the United States Department of Agriculture's approval to use genetically modified seeds to produce sugar-beet.  According to the USDA, this could potentially hinder U.S. sugar production by nearly 20 percent as that genetically modified beets have come to account for 95 percent of the U.S. sugar-beet crop in the past five years and the abstinence of these seeds will force the use of traditional sugar-beet seeds, which make current surpluses of sugar-beet seeds highly susceptible to depletion.  In fact, the USDA anticipates that a shortage of traditional seeds is likely to cut 1.6 million tons from next year's sugar-beet crop.   

    In a nutshell, global demand for sugar continues to rise as production faces headwinds pushing prices of the sweet, edible crystalline carbohydrate higher and is likely to keep prices elevated in the near term. 

    One way to play sugar is through the iPath DJ-UBS Sugar TR Sub-Idx ETN (SGG: 95.49 0.00 0.00%) which tracks an index that intends to reflect the returns that are potentially available through an unleveraged investment in the futures contracts of sugar as well as the rate of interest that could be earned on cash collateral invested in specified Treasury Bills.

    A second play on sugar is through the PowerShares DB Agriculture Fund (DBA: 31.33 0.00 0.00%), which is a more diversified commodity play than SGG and gives exposure to a broad base of soft commodities.  DBA tracks an index which is a rules-based index composed of futures contracts on some of the most liquid and widely traded agricultural commodities.  Furthermore, DBA allocates 12.5% of its assets to sugar futures contracts.

    A third play on sugar could be the UBS E-TRACS CMCI Agriculture TR ETN (UAG: 29.62 0.00 0.00%), which seeks to replicate the performance of an index which measures the collateralized returns from a basket of 10 futures contracts representing the agricultural sector. Furthermore, the commodity futures contracts that are held are diversified across three constant maturities from three months up to one year.  In regards to weightings, UAG allocates 20.86% of its assets to sugar futures contracts.

    When looking at trends, SGG has been in a clear cut uptrend since the lows in May and it appears that it is about to take out its November highs. DBA shows a very similar pattern as it rallies from its lows in June. UAG also displays a similar pattern although the lack of volume creates dots and gaps on the chart so we would be more comfortable using the more actively traded SGG or DBA as our sugar trading vehicles.

    From a risk perspective, the aforementioned ETFs and ETNs carry the inherent risks and volatility that can be found in almost all commodity driven securities.  Of the risks involved, one of the most important to be mindful of is contango.  This phenomenon prevails when the futures contract's prices are being traded at a premium to the spot price and decline over time.   Lastly, when dealing with SGG and UAG, it is important to keep in mind that these are debt structures and carry an additional credit risk that the issuer behind the ETNs could default.  To help protect against these risk it is important to utilize a strategy which helps identify when an upward trend could come to an end.  A quick check at SmartStops.net shows potential problems in store if SGG breaks below $84.77 or if DBA breaks below $29.75.

    Disclosure: No positions

    Technology Stocks: 4 Investment Ideas

    In order to try and find some fertile ground for investments, I was going through the list of sectors in Morningstar and grew curious about softwares.  Today I am reviewing the Software-Architecture industry.  I have thus set up a screen to select companies in the "Software – Infrastructure" industry, with a market cap of over $0.5Bn.

    This gives us a list of 16 companies, which I then filter against some of the criteria that I usually use in my stock reviews to try and evaluate business, balance sheet and valuation risk. You can find the spreadsheet on Google Docs.

    1- Business risk

    The first filter I apply is having a TTM ROE of 12% or more, which gets us down to 20 companies.  Adding a second constraint of having a TTM ROA of 6% or more narrows the list of candidates to 6 companies:

    - BMC Software (BMC: 48.07 0.00 0.00%)

    - CA, Inc. (CA: 24.81 0.00 0.00%)

    - J2 Global Communications (JCOM: 29.90 0.00 0.00%)

    - Microsoft Corporation (MSFT: 27.81 0.00 0.00%)

    - Oracle Corporation (ORCL: 31.675 0.00 0.00%)

    - SolarWinds, Inc. (SWI: 19.41 0.00 0.00%)

    2- Balance sheet risk

    My preferred balance sheet criterion for a stock review is a debt / equity ratio below 1.0x. In this case, this does not change our list given that all of the 6 companies meet that criterion

    3- Valuation risk

    Not only am I looking for good companies, I am also looking for companies that are not too expensive.  I thus add another filter of price to earnings (trailing) being below 20.0x; reducing the number of companies to 4 which I will add to my investment ideas and review in the coming weeks

    Name Ticker % ROE
    TTM
    % ROA
    TTM
    Price/
    Earnings
    Trailing
    % Cash/Market Cap
    BMC Software, Inc. BMC 33.6 9.81 18.21 18.48
    CA, Inc. CA 15.78 6.51 14.9 21.31
    J2 Global Communications, Inc. JCOM 20.64 16.14 16.98 16.98
    Microsoft Corporation MSFT 46.73 21.79 11.05 3.71

    Many happy returns

    Stock Market & ETF News Update: Korea, Ireland And Quiet On The Western Front (SPY, DIA, UUP, TLT)

    Sabres were rattling on the Korean Penninsula today while Europe's troubles percolated on the back burner and U.S. markets meandered in lighter than average pre-Christmas volume.

    South Korea conducted its drills in spite of dire North Korean warnings but the ripples of the conflict spread across the region as the Shanghai Composite (SSEC) dropped -1.4%, bringing its decline from early November perilously close to the -10% marker for an official "correction."

    On the other side of the world, Europe continued struggling with its debt problems as Moody's downgraded Anglo Irish Bank to junk status and Portugal and Greece continue attracting the negative attention of the ratings agencies.  In France, the cost of insuring debt rose to record highs while the Euro declined over concerns of the ongoing banking stress in the Union.

    At home, all was quiet on the Western Front as the dollar (UUP: 23.24 0.00 0.00%) gained, the long bond (TLT: 93.14 0.00 0.00%)  declined and the Dow (DIA: 114.75 0.00 0.00%) slipped into the red while the S&P 500 (SPY: 124.60 0.00 0.00%) remained near two year highs.

    On the technical side of market analysis, we remain in a sideways consolidation, unable to break higher while finding solid support just below current levels.  Momentum continues to wane and the action in China could have bearish implications as the Shanghai Composite is being seen by more and more analysts as a leading indicator as that country's global economic clout continues to grow.

    At Wall Street Sector Selector, we remain in the "Yellow Flag" mode, expecting choppy to lower prices ahead.

    Growth & Income Stock: UnitedHealth Group Inc.

    As more information about the impact of the health care overhaul unfolds, UnitedHealth Group Inc. (UNH: 35.18 0.00 0.00%) continues to deliver impressive results.

    The company recently reported a strong third quarter in which earnings per share beat the Zacks Consensus Estimate by 36%. The company has delivered an average upside surprise of 33% over the last four quarters, leading analysts to raise their estimates significantly higher.

    It is a Zacks #1 Rank (Strong Buy) stock.

    Company Description

    UnitedHealth Group operates several health and "well-being" divisions, but it's most well known is UnitedHealthcare – one of the largest health insurance companies in the United States.

    It competes against other health insurers like Humana Inc. (HUM: 54.84 0.00 0.00%), Aetna Inc. (AET: 30.30 0.00 0.00%) and CIGNA Corp (CI: 36.76 0.00 0.00%).

    The company is headquartered in Minnetonka, Minnesota and has a market cap of $38.6 billion.

    Third Quarter Results

    Earnings came in at $1.14 per share, crushing the Zacks Consensus Estimate by 30 cents. It was a 28% increase over the same quarter in 2009.

    Total revenues were up 9.1% year-over-year driven primarily by an increase in premiums. Meanwhile, total operating costs declined from 92.3% of total revenue to 90.9% as the company successfully contained its medical costs.

    Operating income was up a stellar 28.0%.

    Outlook

    Management stated in the third quarter earnings release that it expects to earn between $3.85 and $3.95 per share in 2010.

    The Zacks Consensus Estimate for 2010 is currently above guidance at $3.98. This equates to 23% growth over 2009 EPS. The 2011 estimate is $3.67, 8% lower than 2010, but up from $3.52 90 days ago.

    Dividend

    UnitedHealth produces strong and consistent cash flow that it has recently been using to buy back stock and raise its dividend. The company significantly hiked its quarterly dividend in the second quarter of 2010 from 3 cents per share to 12.5 cents. It currently yields 1.4%.

    The company has also spent a whopping $1.9 billion year-to-date repurchasing shares.

    Valuation

    The stock is cheap with shares trading at just 8.8x forward estimates, a significant discount to the industry average of 14.4x. Its PEG ratio is an attractive 0.9.

    Its price to book ratio of 1.5 is also lower than its peers at 1.9.

    Todd Bunton is the Growth & Income Stock Strategist for Zacks.com.

    Hot Stocks To Know For Thursday: General Electric, BP, JPMorgan, Visa, MasterCard, Alcoa, Transocean, Microsoft, Google

    Once again, equity markets seemed to be a side-show to movements in the Currency and Fixed Income markets Wednesday.  Treasuries continue to move lower i.e. meaning higher yields & I wonder for how much longer stocks can ignore this increase in borrowing costs (10yr @ 3.51%, 30yr @ 4.6%). US Macro figures were a touch better across the board (CPI 0.1% v 0.2% cons, Empire Manufacturing 10.57 v 5 cons, Industrial Production 0.4% v 0.3% cons) and the markets found a bid in the afternoon  and combined with  ongoing concerns over the sovereign / banking debt  situation in the European PIGS lent a strong bid to the Dollar (the $ index DXY +1%). The GBP was the biggest loser (-1.5%), on a spurious report from Credit Agricole, which spoke about the potential for a post election default in Ireland (given UK's banks massive exposure to Ireland), and contributed to weakness in the EUR.

    Stockswise General Electric (GE: 17.77 +0.28 +1.60%), JPMorgan (JPM: 40.0125 -0.1975 -0.49%) and Alcoa (AA: 14.46 +0.50 +3.58%) dropped at least 1.1% for the biggest declines in the Dow while Visa (V: 67.19 -9.75 -12.67%) and MasterCard (MA: 223.49 -25.73 -10.32%) both  fell more than 1.9% ahead of a Federal Reserve Board meeting tomorrow that may disclose proposed caps on some transaction fees. And US chipmakers slumped after Gartner Inc. predicted spending on semiconductor equipment will drop next year.

    Today's Market Moving Stories

    EU Leaders Meet

    Today EU leaders gather in a two-day summit in Brussels (17:00CET) to address the situation of the Eurozone countries that are facing financial difficulties. However, early signs that the EU leaders will deliver some relief to the Eurozone are not encouraging. According to EU officials, the governments in the region are close to agreeing a minor change in the Lisbon Treaty that could apply from 2013. The amendment foresees a "mechanism to safeguard the stability of the euro area as a whole", with financial assistance provided to distressed governments "subject to strict conditionality" (Bloomberg). But market participants have been expecting measures that could contain contagion stemming from Greece and Ireland spreading into other countries in the Eurozone. Although the ECB has increased the pace at which it buys bonds under its Securities Market Programme and eased contagion fears, it appears adamant that it will not start QE. Furthermore, the proposal related to increasing the size of the EFSF and making it more flexible by allowing purchases of government bonds of peripheral countries has been ruled out by Germany. Whilst the alternative of using jointly guaranteed European bonds, is also unlikely to succeed at the summit, according to one of its promoter Luxembourg PM Jean-Claude Junker.

    Some Surprising Developments in Germany

    Merkel has taken Germany to the brink, but it looks that Germany does not like what it sees. After the extraordinary Steinmeier/Steinbrück article in the FT, Germany's opposition yesterday launched an unprecedented political attack on the German chancellor, accusing her of being un-European. Jürgen Trittin, the leader of the Greens, called her a "Teutonic savings-monster". Frank-Walter Steinmeier, the leader of the opposition in the Bundestag, put his fingers on the issue. If Merkel continues to favour crisis-solution via the ECB, then the ECB ends up as a bad bank. The Left Party's spokeswoman said Merkel's position did not reflect the national interest but those of the banks (a position with which we would agree. Merkel is extraordinarily lazy in the definition of what constitutes the national interest.) Quentin Peel of the Financial Times noted: "The one thing that united almost every speaker was a determination to be the most pro-European. No one sought to blame Ms Merkel for not being German enough."

    For the opposition to break with the chancellor on a European issue so massively, and so loudly, has potentially important implications for Merkel's negotiating position in the European Council today and tomorrow. It is now clear that Merkel represents the German government, but that broader German opinion is more diverse than it seemed previously.

    Spain will push for an extension of the lending ceiling of the EFSF, and for allowing it to buy bonds in the secondary market, thus relieving the ECB. We are now in the perverse position that Germany of all countries is favour a monetisation strategy. (We have to pinch ourselves to check whether this is for real.)

    German Unrest

    The German media also yesterday seemed to have a day of conversion. In an online editorial Der Spiegel invoked Willy Brandt's famous campaign slogan "to dare more democracy" by calling on the European Council "to dare more Europe". It said the Council has been complacent in its anti-crisis response, and was falling to see the historical significance of the situation. The editorial calls for the coordination of all aspects of economic policy, includes taxes, wages, and pensions. Der Spiegel's online edition starts with the headline "Union of the Unreconciled".

    Under a headline "Germany plays politics while Europe drowns", Mohamed El Erian writes in the FT: "The situation this time suggests good economics should play a greater role. Rather than simply doubling up on a faltering liquidity approach, the time has come for Germany to lead a more holistic solution focused on addressing the periphery's debt overhang and competitiveness problems."

    Willem Buiter calls for a big bang approach solution, according to FT Alphaville, which describes his prescriptions thus: "1. Get out their 'big bazooka': Expand the EFSF to €1.7trn to cover potential demands from Ireland, Greece, Portugal, Spain, Italy and Belgium…. 2. Initiate a coordinated process of bank restructuring in the distressed periphery.  Buiter reckons that bank recapitalisation still has a way to go, and that Europe needs to stop kidding itself that senior bondholders can go much longer without a 'short back and sides'. But the process of bank restructuring can't continue piecemeal as this will lead to the 'mother of all contagions' as bondholders dodge countries where they think haircuts are imminent."

    A few people asked why EUR/USD tumbled earlier in the European session. It was on the back of comments from the Swiss National Bank's DANTHINE: who said that we "will continue to pursue the goal of diversification". The market assumes that mean selling EUR for JPY, GBP and USD. SNB currently has US$ 220 billion in reserves; 1 year ago they stood at US$ 79 billion. May was the big month of accumulation, where they bought EUR 78 billion. Most SNB reserves are based in EUR.

    Japanese Pessimism

    Overnight we learnt that Japanese companies are so pessimistic that even the biggest cash piles since 2001 and borrowing costs near five-year lows can't spur them to invest. Cash and equivalents at members of the benchmark Nikkei 225 Stock Average climbed 8 percent to 1,309 yen ($15.60)a share this year, the most since Bloomberg began collecting the data. Companies cut bond sales 17 percent to 9.5 trillion yen this year from last year's record 11.4 trillion yen even as the Bank of Japan reduced interest rates to near zero and average corporate yields dropped for a second year, reaching 0.67 percent in October, the least since July 2005, the data show. "We have more cash than we need, but no growth investments," Kazuto Tsubouchi, chief financial officer at NTT DoCoMo Inc., said in an interview last month. Japan's largest mobile-phone operator reported 529.7 billion yen in cash as of Sept. 30. "This is a great time to issue bonds, and we would if we had no money," Tsubouchi said.

    Irish Good News Story!

    Some half decent economic data from Ireland this morning! Ireland's GDP grew for the second quarter in three in Q3 2010. GDP was 0.5% higher than in Q2 in volume terms, seasonally adjusted. The Q2 change improved from -1.2% to -1%. Following the 2.1% increase in Q1, it means that the economy is now 1.7% bigger in volume than in Q4 2009. That quarter seems to have been the trough of the recession.

    Further evidence that the Irish economy is now out of recession was provided by the GNP numbers (GNP strips out the profits of the foreign-owned multinational sector net of Irish residents' income abroad).  GNP rose 1.1% in Q3 in volume, after a gain of 0.1% in Q2. This is the first time since Q3-Q4 2007 that GNP has expanded for two straight quarters. It is also the largest quarterly increase in real GNP since Q1 2007. GNP tends to be a solid guide to the domestic economy.

    Of course nominal variables matter too, especially in the context of debt sustainability. Here the evidence was encouraging: nominal GDP has now grown for three quarters in a row. That had not occurred since Q1 – Q3 2006. Nominal GNP increased by 1.9% in Q3, the same as in Q2.

    Exports are driving the re-emergence of economic growth. Exports increased 3.9% quarter-on-quarter in Q3, following the 2% gain in Q2 and the 6.9% jump in Q1. In volume terms, the cumulative rise in exports since the bottom at the end of 2009 is now 13% (17% in value terms). Exports were up 13.2% in volume year-on-year in Q3 (+15.1% in current prices). That marked the most rapid rate of export growth since Q1 2001. In comparison, euro area-16 exports increased 11.3% in volume in Q3 compared with Q3 2009 (the annual gain was 10.7% for the EU-27 and 12.6% for the US in Q3). Ireland's goods exports increased 12.9% in the last 12 months, while services grew by 13.6%.

    Imports are also growing quickly: up 11% year-on-year in Q3 in volume (there is a high-import content in Irish goods exports in particular). But that did not prevent the biggest current account surplus since Q4 2003 at €255m in Q3. Ireland is no longer living beyond its means. Most forecasts predict a current account surplus for the full year 2011.

    It is disappointing that consumer spending has not yet bottomed in real terms: spending slipped 0.5% in Q3, following -0.1% in Q2 and -0.3% in Q1. Investment is still weak and choppy. It fell 18% in Q3, following the 11% increase in Q2. But that marked a new low for fixed investment (in structures and machinery and equipment). Investment is now back to 1998 levels, as payback for the bubble period in 2002-2007. Government spending is declining in line with the programme of fiscal austerity.

    Looking at the output accounts of the different economic sectors,  it is clear that the economy is two-speed. Industry and agriculture are growing rapidly, but private services, public services and construction are shrinking still (although construction now makes up a smaller portion of the economy than the European average).

    Company / Equity News

    • Stocks on the move today in Europe include Ericsson which has rallied 3.7% as Svenska Handelsbanken raised its recommendation to "accumulate" from "reduce," saying gross margins will be "stronger for longer."
    • Travis Perkins owner of the Wickes home improvement-products chain, gained 1.7% as Deutsche Bank AG gave the shares a "buy" rating in new coverage.
    • BP (BP: 43.75 -0.11 -0.25%) has lost 1.8%, the biggest drop in a month. The company put profits over safety and is responsible for the Deepwater Horizon drilling rig explosion that set off the largest offshore oil spill in U.S. history, lawyers suing the company said in a new court filing. BP and other companies connected to the well "ignored crucial safety issues, cut corners and violated federal and state law to save time and money in favour of production and profit," lawyers for thousands of businesses and individuals claiming economic losses from the spill said in a master complaint filed in federal court in New Orleans. Transocean Ltd (RIG: 69.31 -2.58 -3.59%) which owned the Deepwater Horizon rig and is also a defendant in the lawsuit, fell 3.8% today.
    • BAA has released its latest investor report for the two London airports securitized via BAA Funding Limited, which includes forecasts for 2010 and 2011. They are forecasting 88m passengers for Heathrow and Stansted in 2011, a strong increase of 3.7% over their latest estimate of 84.8m for the full year 2010, although about half of the increase will be the catch up effect from the disruption earlier in 2010. The split will be 6.2% growth for Heathrow, and a 5.1% decline at Stansted. Perhaps more significantly BAA are forecasting a 15.2% increase in 2011 EBITDA to GBP1,120m driven by these higher passenger numbers and the 4.7% RPI plus 7.5% tariff increases at Heathrow from April 2011.
    • Carrefour: A report in Les Echos suggests that Carrefour is considering either an IPO or spin off of its property division and considering options for its discount division. Carrefour's freehold property was valued at EUR16.7bn in the most recent accounts, whilst the discount division has been reported as being worth around EUR4bn. These are both longstanding stories, and are likely to be actively considered given the recent weak share price performance as well as the threat to its credit ratings (certainly Moody's). I continue to think that it is within Carrefour's control to avoid a downgrade from Moody's – flexing the share buyback is another alternative – with the odds of a cut being less than 50% in my view.
    • Microsoft Corp. (MSFT: 27.9875 +0.1375 +0.49%) updated its Bing search engine today, aiming to build on U.S. market-share gains last month as it chases Google Inc. (GOOG: 591.71 +1.41 +0.24%). Bing, which ranks third in the market, accounted for 11.8 percent of U.S. searches in November, up from 11.5 percent the previous month, Reston, Virginia-based ComScore Inc. said today. While Google remained dominant, its share slipped to 66.2 percent from 66.3 percent. Yahoo! Inc. remained second.
    • Facebook is likely to generate 2010 revenue of about $2 billion, a larger sum than projected earlier, according to three people familiar with the matter. Sales will more than double from 2009, said the people, who declined to be identified because the privately held company doesn't disclose revenue. Facebook had $700 million to $800 million in sales last year, and the 2010 figure was previously expected to be closer to $1.5 billion, according to two other people familiar with the matter earlier this year.
    • Twitter has said it's valued at $3.7 billion after receiving a $200 million round of funding led by venture capital firm Kleiner Perkins Caufield & Byers. The company also added two directors to its board, Chief Executive Officer Dick Costolo said in a blog post. Twitter spokesman Matt Graves provided the valuation in an e-mailed statement. Twitter, which has more than 175 million users, can use the funds to hire more people for its advertising service, which began earlier this year. The San Francisco-based company started in 2006 and has more than 350 employees, up from 130 a year ago.

    Hot Option Plays: Market Stuck At Resistance

    Cusick's Corner
    This has been a nice and orderly Expiration week even with futures and December options coming off over the next 24 hours. The market is watching earnings — been positive, the bonds — prices have firmed and the EU — finance ministers have been quiet. The market is still stuck at resistance and needs to break through with conviction. We are at levels that we have not seen in years. Leading Indicators are due out in the morning and if you have a December option, make sure that you are managing it — tomorrow is Expiration Friday. See you Midday.

    Stocks finished higher with help from economic news Thursday. Data released before the opening bell showed Housing Starts up to an annual rate of 555,000 in November, from 534,000 the month before and better than the 545,000 economists had predicted. Separate data showed weekly jobless claims falling by 3,000 to 420,000 in the period ended December 11. Economists were looking for an increase of 2,000. Then, later in the day, the Philadelphia Fed Survey was release and showed surprise improvement to 23.4 in December. Economists were looking for the gauge of manufacturing activity to fall to 13.0, from 22.5 the month before. While trading was choppy early, stocks found some strength on the heels of the stronger manufacturing numbers. Through midday, the Dow Jones Industrial Average was up 45 points. Not much happened from that point forward. At the closing bell, the Dow was up 42 points. The tech-heavy NASDAQ added 20. Volume and volatility might pick up a bit tomorrow morning due to the Quadruple Witch options expiration. Check your positions and know your assignment/exercise risks. Tomorrow is the last day to trade December options.

    Bullish Flow
    AK Steel (AKS: 15.36 +0.95 +6.59%) saw relative strength and increasing call volume Thursday. Shares traded up 95 cents to $15.36 and closed the day very near session highs. It's not clear what was driving the gains, but other names in the sector (X, MT, STLD, NUE) posted solid gains as well. So, it might be a sector play. Meanwhile, in AKS options, call volume surged. 29,000 contracts changed hands, which is 4X the normal and almost 10X the day's put volume. January 19 calls, which are 23.7 percent out-of-the-money with roughly five weeks left till expiration, were the most actives. 10,730 traded. December 15, Jan 15, Jan 16, and Jan 17.5 calls saw brisk trading as well.

    Bullish order flow was also seen in Overstock.com (OSTK: 17.30 +0.81 +4.91%), NASDAQ OMX Group (NDAQ: 23.46 +0.93 +4.13%), and Winnebego Industries (WGO: 14.96 +1.87 +14.29%)

    Bearish Flow
    Fifth Third (FITB: 13.92 -0.24 -1.69%) saw volatile market action Thursday. Shares sank on increasing volume in afternoon trading and finished the day down 24 cents to $13.92. Options volume hit 3X the average daily. 22,000 puts and 3,540 call options traded on the regional bank. December 14 puts, which expire at the end of the week, were the most actives. More than 11,130 traded. In addition, open interest is 1,169 and 54 percent traded at the ask, suggesting buyers were opening some of the day's trades. There was no news on the stock, but the volatile action in the stock and short-term put buying seems to reflect anxiety about the outlook for FITB ahead of the weekend.

    Bearish flow also picked up in AstraZeneca (AZN: 49.23 -0.05 -0.10%), MonsterWorldwide (MWW: 24.71 +0.46 +1.90%), and Anheuser Busch (BUD: 57.46 +0.34 +0.60%).

    Index Trading
    Options action picked up in the index market due to the options expiration. Many (not all) cash-settled index options stop trading Thursday because settlement values are computed Friday morning, before the expiration Saturday. Consequently, volume often picks up on the Thursday before expiration Saturday. Today, for example, 764,000 calls and 539,000 puts traded across the S&P 500 Index (.SPX) and other cash indexes. The top trades of the day were in the CBOE Volatility Index (.VIX), which unlike other cash indexes expires on Wednesdays. VIX finished the day down .55 to 17.39 and one strategist apparently sold 23,500 January 37.5 calls at 15 cents each to buy 23,500 February 37.5 calls at 55 cents. This calendar spread, for a net debit of 40 cents, was possibly a roll and or a bet that VIX will stay below 37.5 through the January expiration before rallying into February.
    ETF Trading

    Trading in the exchange-traded fund options surged Thursday, not only because of the expiration, but because of dividend-related trading activity. About 15 million calls and 3.55 million puts traded across the exchange-traded funds. December 15 calls on the Financial Select Sector Fund (XLF: 15.50 +0.02 +0.13%) were among the most actives. 1.89 million contracts traded! Shares added 2 cents to $15.50 and the surge in volume in these in-the-money calls is related to a strategy, implemented primarily by institutional investors, designed to profit from the fact that not all in-the-money calls will be exercised around the dividend, which is normally the optimal thing to do.

    Coming Tomorrow: Mackinac Center For Public Policy Cigarette Taxes And Smuggling Study

    State cigarette excise taxes vary around the country from a low of 17 cents per pack in Missouri to a whopping $4.35 per pack in New York (see map above, data here). Add another $1.50 per pack in New York city taxes, and a pack of Marlboros in Manhattan can now cost as much as $14, according to this recent New York Post article.  As you might expect, those prohibitively high taxes have fueled a huge black market in New York, and the Post reported that "Illegal cigarettes are pouring into neighborhood bodegas by the truckload from neighboring Indian reservations, lower-tax states in the South and even as far away as China."

    In a study to be released tomorrow by the Midland (MI)-based Mackinac Center for Public Policy on cigarette smuggling rates for 47 of the contiguous states, Director of Fiscal Policy Mike LaFaive and co-author of the study, estimates that 47.5% of cigarettes purchased in the state of New York during 2009 were smuggled.  And that was before the $4.35 per pack tax went into effect in July. According to the Mackinac Center research, the top five states for cigarette smuggling in 2009 were:
    Arizona (51.8 percent);
    New York (47.5 percent);
    Rhode Island (40.5 percent);
    New Mexico (37.2 percent); and
    California (36.3 percent).
      
    Arizona's high smuggling rate can be explained by recent tax hikes there and its proximity to Mexico.  Rhode Island's third place smuggling rank is likely due to its $3.46 per pack cigarette tax in 2010, second only to New York.  
    The new study is an update of the Mackinac Center's 2006 study "Cigarette Taxes and Smuggling: A Statistical Analysis and Historical Review."  More details to follow once the final report is released publicly tomorrow. 

    Keep Your Eye On This Stock Wednesday

    With the major market indexes testing clear-cut resistance levels, it may be time to turn our attention to short term selling opportunities. Dominion Resources, Inc. (D: 41.83 -0.07 -0.17%) has been trending quietly lower the last six weeks and is beginning to show early signs of weakness, which could yield short term profits! Check it out.

    Sell Signal

    The Modified PEMA Crossover system has fired a new Short opportunity for $D, which has been in the midst of a six-week down trend. Every pull-back has been a selling opportunity recently, which bodes well for the current sell signal.

    If price remains below $42.50, this stock has a shot at dropping below $41 in the days ahead, with a target somewhere between $40.50 and $41.00.

    Dominion Resources ($D)

    Bearish Confluence

    There are two additional layers of pivot-based resistance that form a powerful form of bearish confluence: the pivot range and the yearly H3 Camarilla pivot level.

    During trending markets, the pivot range can serve as support in an uptrend, and resistance in a down trend. Since $D is currently holding below the top of the pivot range at $42.40, downtrending behavior should remain intact.

    Watch for a break through the bottom of the range at $41.80 for signs of downside follow-through.

    Additionally, the $42.40 level also happens to be the yearly H3 Camarilla pivot level, which is usually seen as a bearish zone. Clearly, $D has responded to this pivot and price level throughout the year, which means another round of selling could be ahead.

    Again, as long as $42.50 remains untouched, look for a potential drop back toward $40.50 to $41.00.

    Let's see how this one plays out!

    Stock Picks For Thursday: DryShips, VIVUS, Cisco, ARCA Biopharma, Eastman Kodak

    ( click to enlarge )

    DryShips Inc. (DRYS: 5.91 -0.1099 -1.83%)  suffered another day of profit taking with a 1.83% pull back but traders bought the dip at $5.90. Today's stock price action looks like further consolidation after Friday morning's big spike up. The technical picture is mixed but the medium-term trend is bullish and I suspect that DRYS is poised to move higher from here. My first target to take profits is at $6.83.

    ( click to enlarge )

    The big news with VIVUS, Inc.(VVUS: 9.00 +1.20 +15.38%) today was that Orexigen's drug Contrave had cleared a major regulatory hurdle on the road to approval. I believe it was today's news that accounted for VVUS big volume today. Usually when we see big volume and no movement with a stock near its highs I suspect it's distribution and bulls should turn more defensive. At this stage, the stock might be due for a rest so watch for a dip back toward $8.70. A closer look at the RSI reveals that the stock is extremely Overbought. On the other hand, fresh exposures may be considered on a move above $9.32, with a stop-loss at $8.70.


    The overall trend in Cisco Systems, Inc. (CSCO: 19.35 -0.04 -0.21%) remains bearish but looking closely at the chart above we can see that in the short-term the stock is trying to bounce from oversold conditions. I've been concerned that the lack of downward momentum at this level is suggesting a short-term bottom. Before buying this stock, I want to see the price break the resistance of $19.70 and the 20 day moving average to the upside. On the other hand a drop under $19 would be very bearish and reinforce the downtrend.


    ARCA biopharma, Inc. (ABIO: 3.19 -0.32 -9.12%) continues to sell-off and on big volume, which is normally a bearish sign. The stock lost 9%. In terms of technical levels, the next major support is seen at 3.10 followed by 3.01.

    ( click to enlarge )

    I do not see any significant changes from my previous updates on Eastman Kodak Company (EK: 4.77 +0.15 +3.25%). The stock continues to look bullish. Keep an eye for a possible breakout over $4.85.

    Unusual volume in today's trading session

    ACTC – Advanced Cell Techn
    AVTI – Avitar, Inc.
    GOIG – GoIP Global, Inc
    TAON – Tao Minerals
    EDWY – eDoorways International Corp.
    OREX – Orexigen Therapeutics
    ARNA – Arena Pharmaceutical
    SWC – Stillwater Mining Co
    VVUS – Vivus, Inc.
    SMVI – Social Media Ventures Inc.
    KFN – KKR Financial Hldg
    IVN – IVANHOE MINES LTD ORD
    GCHK – Ridgestone Resources
    PUDA – Puda Coal Inc
    TECO – TECO Energy, Inc.
    GCOG – Gulf Coast Oil and Gas, Inc.
    BLAP – Blast Applications, Inc.
    MW – Men's Wearhouse Inc
    GST – GASTAR EXPLORATION
    ALXA – ALEXZA PHARMACEUTICAL
    CWTR – Coldwater Creek, Inc.
    GDOT – Green Dot Corporation
    BJCHF – Beijing Capital International Airport Company Limited
    MNTA – MOMENTA PHARMACEUTICAL
    TASR – TASER International
    NWD – New Dragon Asia Corp
    RNRG – REVONERGY INC
    CALCQ – California Coastal
    AGL – A G L RESOURCES INC
    ITCD – ITC DeltaCom, Inc.
    KFY – KORN FERRY INTL
    EXSFF – Explor Resources Inc
    CSKH – Clear Skies Slr
    PRKR – ParkerVision, Inc.
    INKN – Shrink Nanotechnology
    AVNW – Haris Stratex
    CYBI – Cybex International
    CRME – CARDIOME PHARMA CP
    BAESY – BAES SYS PLC SPONS ADR
    LSTZA – Liberty Media Corp
    RFLMF – Riversdale Mining Ltd
    ETRM – EnteroMedics Inc
    VIZS – VizStar Inc
    PDEP – Diamond One Inc
    HPLF – Zeta Corp

    New 52-week High stocks

    OREX – Orexigen Therapeutics
    XOM – EXXON MOBIL CORP
    SLE – SARA LEE CORP
    ONNN – ON Semiconductor Co
    CVX – Chevron
    KOG – KODIAK OIL & GAS CP
    GNTX – Gentex Corporation
    LYB – Lyondell Basell Ind
    ADI – ANALOG DEVICES INC
    ENTR – Entropic Communication
    WIN – Windstream Corp
    MCHP – Microchip Technology
    URI – UNITED RENTALS INC
    KFY – KORN FERRY INTL
    AKAM – Akamai Technologies
    KBR – KBR Inc
    CPWR – Compuware Corporation
    NVLS – Novellus Systems, Inc.
    COO – COOPER COS INC NEW
    FO – FORTUNE BRANDS INC
    ARBA – Ariba, Inc.
    OII – OCEANEERING INTL INC
    CSE – CAPITALSOURCE INC
    SINA – sina.com
    LRCX – Lam Research Corpor
    MXIM – Maxim Integrated Pr
    ANAD – ANADIGICS, Inc.
    NXPI – NXP Semiconductors NV
    IDCC – Interdigital Communication
    FISV – Fiserv, Inc.
    EXPD – Expeditors International
    BIIB – IDEC Pharmaceutical
    ROVI – Macrovision Corporation
    DDS – DILLARDS INC CL A
    CPHD – CEPHEID
    LINE – LINN ENERGY LLC UTS
    VRSK – Verisk Analytics

    MACD Bullish Cross

    YHOO – Yahoo! Inc
    MFC – MANULIFE FINANCIAL
    MDT – MEDTRONIC INC
    RELM – Relm Holdings, Inc.
    VMED – Virgin Media Inc
    UBS – UBS AG
    ACAS – American Cap Ltd
    BCS – BARCLAYS P L C
    NRTLQ – NORTEL NETWORKS CORPORATION
    ADLS – ADVANCED LIFE SCIENCE
    CTIC – Cell Therapeutics
    ZMH – ZIMMER HOLDINGS INC
    PGR – PROGRESSIVE CORP
    HBC – HSBC Holdings PLC
    MCP – Molycorp Inc
    DV – DEVRY INC
    HPLF – Zeta Corp
    PBI – PITNEY BOWES INC
    RDS.A – ROYAL DUTCH SH A
    AVAV – AeroVironment Inc
    L – LOEWS CORP
    ERJ – EMBRAUER EMPRESSA BRA
    AHL – ASPEN INSURANCE HLD
    E – E N I SPA ADR
    DLTR – Dollar Tree Inc
    CS – CREDIT SUISSE GROUP
    ACLS – Axcelis Technologies
    QGEN – Qiagen N.V.
    ESI – I T T EDUCATIONAL SVCS
    XPRT – LECG CP
    DB – DEUTSCHE BANK AG
    BKI – BUCKEYE TECHNOLOGIES
    VSYM – View Systems Inc
    BEAT – CardioNet Inc
    MELA – Mela Sciences

    Stocks that gained more than 10 per cent during the day

    AVTI – Avitar, Inc.
    TAON – Tao Minerals
    ALTO – Alto Group Holdings
    OPTZ – Optimized Transportation Management, Inc.
    HTDS – Hard to Treat Diseases Inc.
    SOLR – GT Solar International
    ZVTK – Zevotek, Inc.
    PASO – Patient Access Solutions, Inc
    BLOAQ – Blockbuster Inc
    ALXA – ALEXZA PHARMACEUTICAL
    AVVH – AvVaa World Health Care Products, Inc.
    LXRX – Lexicon Genetics In
    LGTT – LIGATT Security International, Inc.
    KFY – KORN FERRY INTL
    GNTA – GENTA INC

    Disclaimer : This is not an investment advisory, and should not be used to make investment decisions. Information in AC Investor Blog is often opinionated and should be considered for information purposes only. No stock exchange anywhere has approved or disapproved of the information contained herein. There is no express or implied solicitation to buy or sell securities. The charts provided here are not meant for investment purposes and only serve as technical examples. Don't consider buying or selling any stock without conducting your own due diligence.